Understand Performance Better: The New Analytics Experience Is Here
Performance data should help teams make decisions, not create more work.
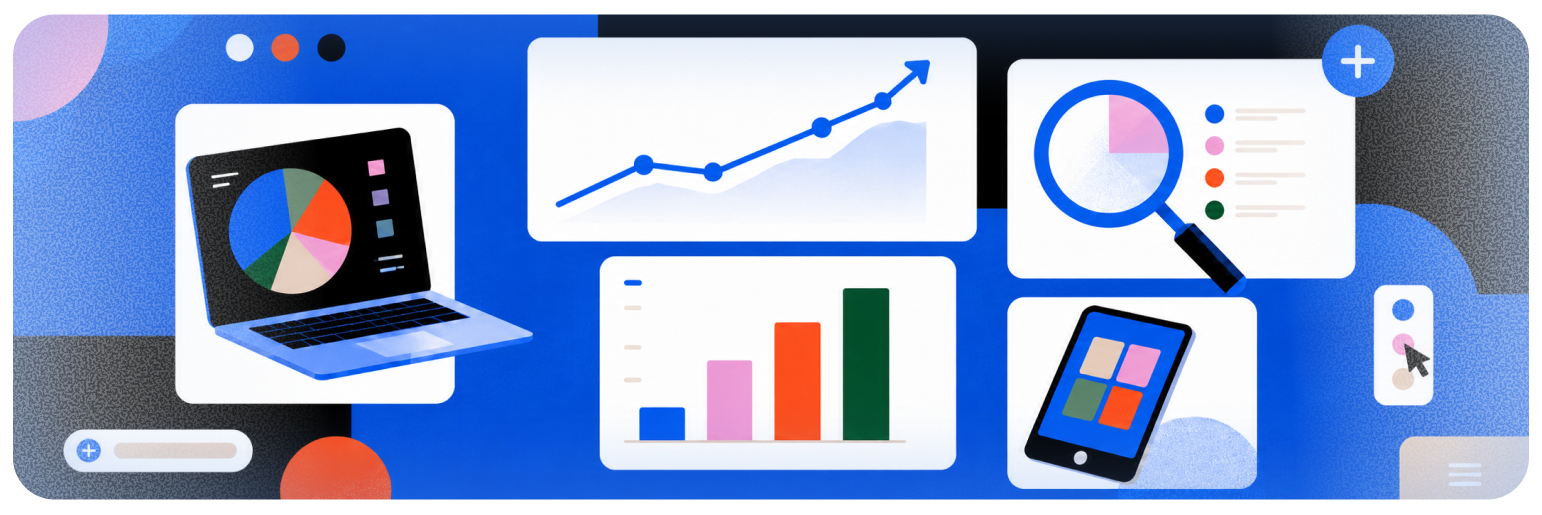
For many retail media operators, understanding campaign performance still means exporting reports, comparing date ranges manually, and jumping between dashboards to answer simple questions. As retail media programs grow, those workflows become slower and harder to scale.
Today, we're introducing a redesigned Analytics experience in Topsort.
The new Analytics page helps marketplaces, retailers, and advertisers understand performance faster with richer visualizations, period-over-period comparisons, trend analysis, and deeper filtering capabilities, all while preserving the metrics teams already rely on every day.
Why This Matters
Retail media teams are under increasing pressure to demonstrate performance, identify optimization opportunities, and make budget decisions quickly.
But raw metrics alone rarely tell the full story.
A ROAS number without historical context doesn't explain whether performance is improving. A drop in sales doesn't reveal whether the issue is related to clicks, conversions, or spend efficiency. And investigating a specific vendor or campaign often requires exporting data into spreadsheets for further analysis.
The new Analytics experience is designed to eliminate that friction by bringing performance insights directly into the platform.
Understand Performance at a Glance
The redesigned page introduces a series of analytics cards that combine key metrics, historical comparisons, and trend visualizations in a single view.
Teams can immediately understand:
- How efficiently ad spend is driving returns
- Which vendors are generating the strongest results
- Whether conversion performance is improving or declining
- How click-through rates are changing over time
- Whether cost-per-click trends indicate increasing competition
Rather than viewing metrics in isolation, users can now evaluate performance in context.
Identify Top-Performing Vendors Faster
One of the most requested workflows in analytics is understanding which vendors are driving the strongest outcomes.
The new Top 10 Vendors card provides an immediate view into vendor performance and allows users to compare vendors across metrics such as ad spend, promoted sales, and other key marketplace performance indicators.
Instead of building custom reports, teams can now quickly identify top contributors and prioritize optimization efforts directly from the analytics experience.
Investigate Specific Vendors and Campaigns
The new Analytics page goes beyond high-level reporting.
Users can now filter the entire page by: Vendor, Campaign name, Campaign ID. Once a filter is applied, all analytics cards and visualizations automatically update to reflect performance for the selected vendor or campaign.
This allows users to answer questions such as:
- How is a specific vendor performing over time?
- Which campaigns are driving the strongest returns?
- Is a decline in ROAS isolated to a particular campaign?
- How does performance compare across different advertisers?
Without leaving the analytics page, teams can move from performance monitoring to investigation in just a few clicks.
Familiar Metrics, Better Insights
All metrics available in the previous analytics experience remain available.
Core reporting metrics, including ad spend, impressions, clicks, purchases, and ROAS, continue to be accessible through a collapsible summary section at the top of the page.
This means teams can continue using the metrics they know while benefiting from richer visualizations and deeper analysis tools.
Built for Better Decision-Making
The goal of the redesigned Analytics experience is simple: make performance easier to understand, and drive better decision-making.
By bringing together key metrics, trend analysis, vendor insights, and campaign-level filtering in a single view, the new Analytics page helps teams move beyond reporting and uncover the drivers behind performance.
The result is a clearer, more actionable understanding of retail media performance, helping teams not only see what happened, but understand why it happened and where to focus next.
The new Analytics experience is now available in Topsort.
Read more about this feature in the Topsort Changelog.
Talk to a Topsorter to learn more.